At the heart of of what we do here at Atomic is a commitment to transparency. We founded Atomic.Finance in response to the opaque nature of existing financial tools on Bitcoin. We wanted to write this blog post in an effort to shed more light on our backtesting process for the Conservative Covered Call Strategy.
Background on Passive Strategies and Atomic.Finance's Evolution
Atomic.Finance has evolved to offer users a passive return on their Bitcoin through passive options strategies, all while holding their own keys thanks to Discreet Log Contracts. This non-custodial approach also ensures users can verify the location of their funds on-chain at all times.
- From Manual to Passive: In our early days, we offered manual covered call positions, akin to platforms like Robinhood, where users selected their own strikes. However, feedback from our early adopters, many of whom were not traders, revealed a preference for passive strategies. The allure of Atomic was its non-custodial value, not the complexities of manual trading.
- The Power of Backtested Strategies: Passive strategies that are backtested with historical data benefit from having been tested rigorously against historical data and different market regimes in Bitcoin's history. They also help remove emotion from the equation and make earning a return with instruments like options a lot less time consuming for the average user.
- The Future: While our current focus is on passive strategies, we recognize the appeal of manual positions for folks who have more experience with the markets and prefer a manual approach. We're considering reintroducing this feature, allowing users the flexibility to choose their approach.
Why start with covered calls?
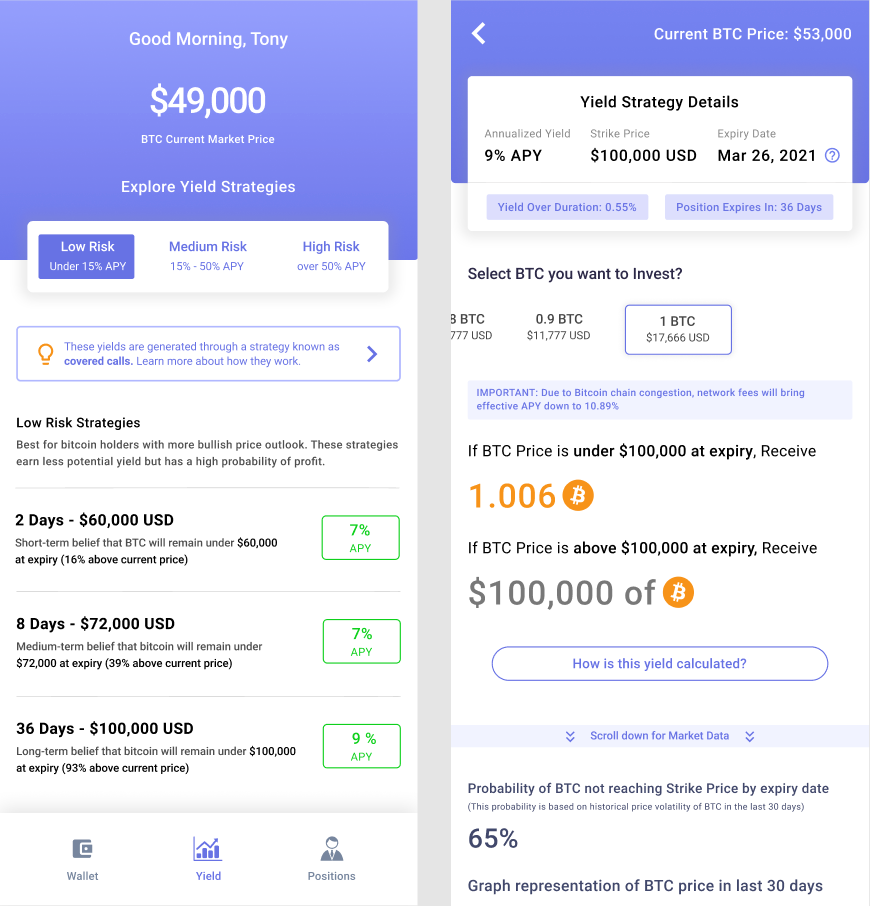
When it comes to options strategies, covered calls are perhaps the most conservative one out of the bunch. With covered calls, users always either end up with either more BTC or a BTC stack that is worth more in USD terms. There's never a risk of liquidation or total loss. And of course with DLC's there's no custody / counterparty risk either. That's why we decided to start with covered calls as our first strategy.
There's no doubt to me that over time, we'll be looking to explore more (and perhaps higher risk & higher reward) strategies moving forward!
💡 A quick note about Technical Analysis (TA)
We get it. There's quite a few folks out there who see TA as mere "line drawing" on graphs. Indeed, like many financial tools and strategies, TA is not infallible. But let's set the record straight:
- TA is grounded in the belief that price movements aren't purely random. Past price movements can often indicate future price directions. TA is about recognizing patterns and trends based on historical data.
- Major funds and successful traders, like Paul Tudor Jones and Jane Street, incorporate TA as a core component of their trading strategies. If TA was mere guesswork, it wouldn't be so widely used in the financial industry.
- TA's strength also lies in its ability to be verified with historical data, providing a quantitative way to actually backtest trading logic with data. (It's pretty hard to backtest / verify trading decisions based on fundamental analysis!)
The Need for Discretion
While we're eager to share our process, we must strike a balance between transparency and protecting the integrity of our strategies. Revealing too much could risk our strategies being front-run, compromising the strategy's effectiveness and performance for existing users. So, while we'll provide insights, some specifics will intentionally remain vague. It's a tension we constantly wrestle with, because of how important transparency is to our identity. But our priority remains the same: ensuring the best outcomes for our users.
With that out of way, let's dive into the backtesting process. There's three primary components to the backtesting process that we used to develop the Conservative Covered Call Strategy:
- TA Fitting, which involves backtesting with BTC spot market data going back to 2012 to assist with timing covered call entries.
- Options Backtest, which involves verifying the TA Fitting backtesting with BTC options data going back to 2019.
- Incubation, which involves monitoring the performance of the strategy in real time.
TA Fitting : Identifying sideways or downwards trends
The aim with TA Fitting is to reliably avoid market pumps. The risk with covered calls is having exposure during a market surge, which then leads to lost upside. Our goal is to minimize this risk by being able to reliably identify points in times when BTC is statistically likely to be in a sideways or downwards trend.
This involves using indicators to identify points in time (or “signals”) where it's statistically likely for BTC to enter a sideways or downward trend. This is achieved by leveraging various indicators that have historically proven effective in detecting such trends, and we verified the effectiveness of these indicators against BTC spot data going back to 2012!
By having access to price data going all the way back to 2012 and being able to test our TA Fitting logic against the last 11 years of BTC market data, it ensures that our strategies are not just based on recent trends but have been tested across a diverse set of market cycles and regimes. This helps ensure a more robust strategy for users.
Avoiding overfitting: Overfitting occurs when a model or strategy is tailored too closely to a specific dataset, making it perform exceptionally well on that data but poorly on new, unseen data. In essence, it's like memorizing the answers to a specific test but failing when presented with a new set of questions.
To counteract this,
- KISS (Keep it simple stupid): We adhere to the principle of simplicity in designing the TA Fitting logic. Instead of creating a convoluted model that fits every twist and turn of our historical data, we aim for a more generalized approach.
Let's use an example to illustrate this: If I “came up” with a backtested strategy that said “Buy BTC at $3.9K and sell it at $69K”, and backtested that over the past 4 years, I'd probably be pretty happy with the backtested performance considering those were the exact highs and lows we saw in the past cycle. But I'm willing to bet that this strategy won't perform nearly as well in the upcoming 4 years, because it was overly fitted to the twists and turns of the past 4 years of the BTC market. It's not sufficiently generalized. - Walk-forward testing: Furthermore, we employ walk-forward testing. This is a concept that has been the subject of entire research papers, but I'll attempt to explain it succinctly.
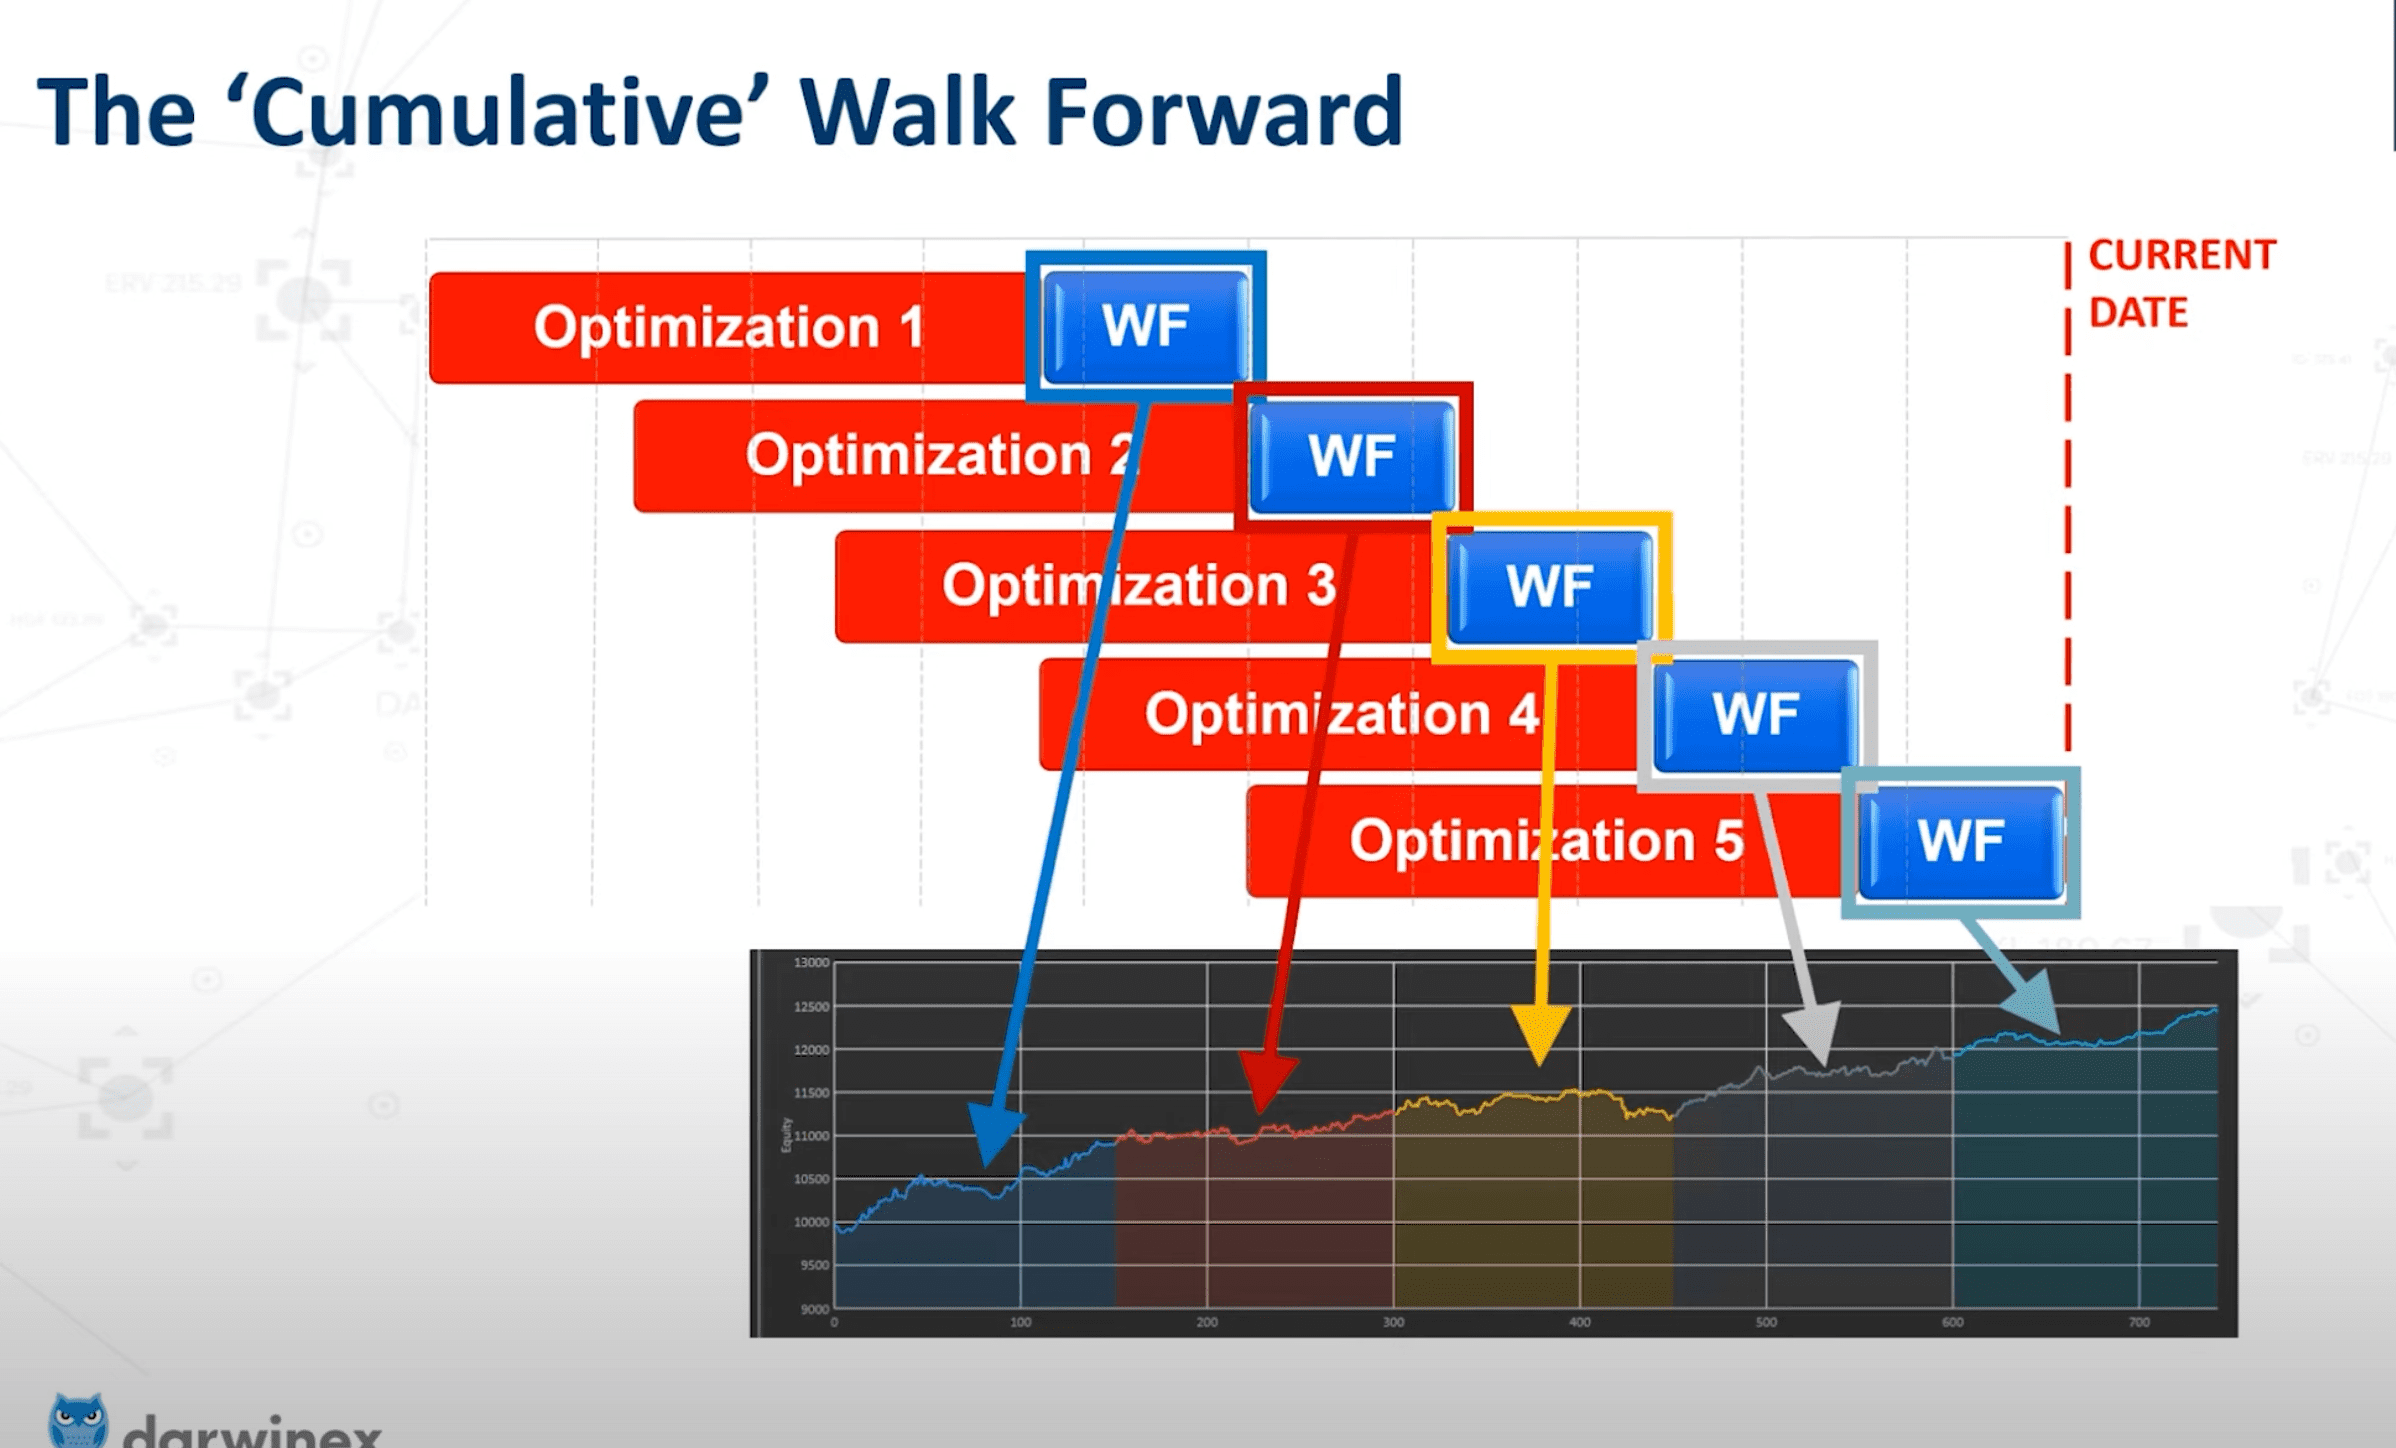
Walk-forward testing involves using a chunk of historical data (the “in-sample” data) to train our strategy and then testing that strategy on market data from a subsequent time period that the strategy was not trained on (the “out-of-sample” data). This allows you to more accurately gauge the efficacy of a strategy since you're repeatedly testing it against unseen, out-of-sample data.
The in-sample time window is then shifted forward by the period covered by the out of sample test, and the process is repeated. By continuously "walking forward" through time, we ensure our strategy remains relevant and adaptive to changing market conditions.
Options Backtest
Once we have a reliable way to generate signals from our TA fitting, the next step is to see how these signals would have performed in real-world options trading scenarios with the help of historical options market data.
For this portion of the backtesting process, we collected BTC options pricing data from Deribit from 2019 until now, which is when BTC options market data first became available.
This backtest involves three primary considerations:
- Strike Selection: We test selling covered calls at various distances from the market price (eg. 15% above the market price at the time signal is generated vs 5%).
A strike too close might increase the likelihood of a loss, while one too far might not be lucrative or might lack liquidity. You must strike a balance somewhere in the middle. - Minimum Premium Setting: It's essential to ensure that the potential returns from a covered call justify the risks taken. By setting a minimum premium, we avoid scenarios where the potential earnings are just far too meager compared to the risks. You don't want to be picking up literal pennies in front of the steam roller. You might as well just sit tight and do nothing.
In these scenarios, even if there was a signal generated by TA Fitting, the strategy may elect to skip on taking a position anyway simply due to the premiums being below the minimum premium we set out in the backtest.

An example of this at work is August '23. Even though there were several instances of TA Fitting indicating a sideways or downward trend, no positions were taken from Jul 21st until now (near the end of August) due to the minimum premium setting. During this period, implied volatility in the Bitcoin options markets have been at a historic low!
3/ 🗓️ Over the past 30 days, BTC's price has ranged within a 9.8% band. Just a mere 2.8% of all previous months In BTC's history since 2014 has been tighter than this.
— Atomic.Finance ⚛️ #SoundFinance (@TonyCai_) August 14, 2023
This level of consolidation and volatility compression is nearly unprecedented for #Bitcoin. 🤯 pic.twitter.com/xbEWiHIwSG
5/ Volatility Crush in Options: The BTC options market is painting a clear picture - implied volatility is at an all-time low. Historically, Bitcoin options traded with a volatility of 60%-100%.
— Atomic.Finance ⚛️ #SoundFinance (@TonyCai_) August 14, 2023
Now? We're seeing numbers between 24% and 52%. That's a significant drop! 📊 pic.twitter.com/nh1xEMVzr0
- Optimizing for risk-adjusted returns: With these two considerations in mind, we then optimize for a good risk-adjusted return, striking the right balance between potential returns and risk.
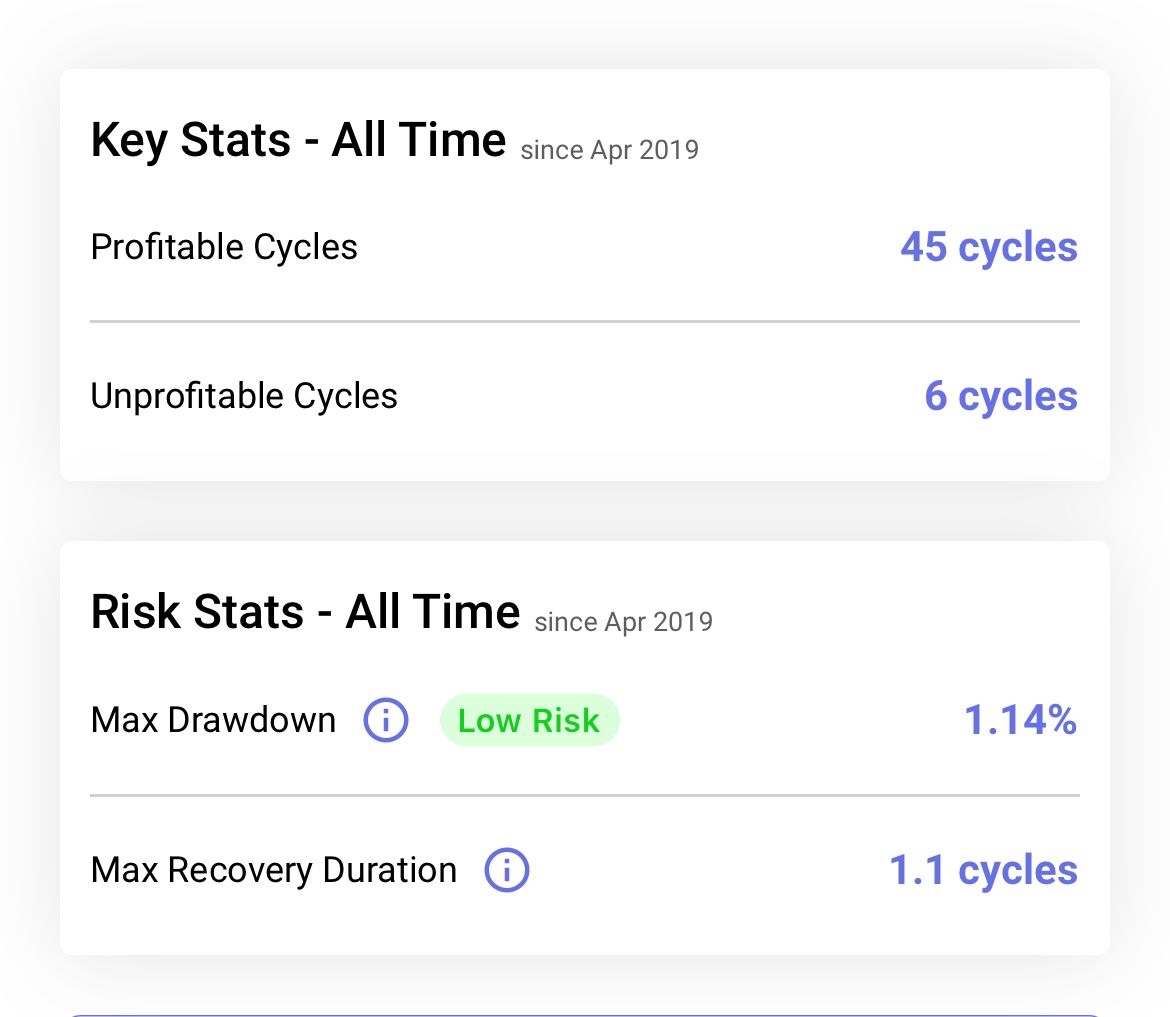
Specifically, we look at the net returns in relation to the maximum drawdown (the most significant drop in value over a specified time period). This metric ensures that our chosen strategy isn't just about high returns but also about managing and mitigating potential losses effectively.
Incubation: Checking our work
After all this, naturally, we're at an emotional high. The strategy has survived through all this rigorous testing and has a lot of promise. But, it's important to check our work!
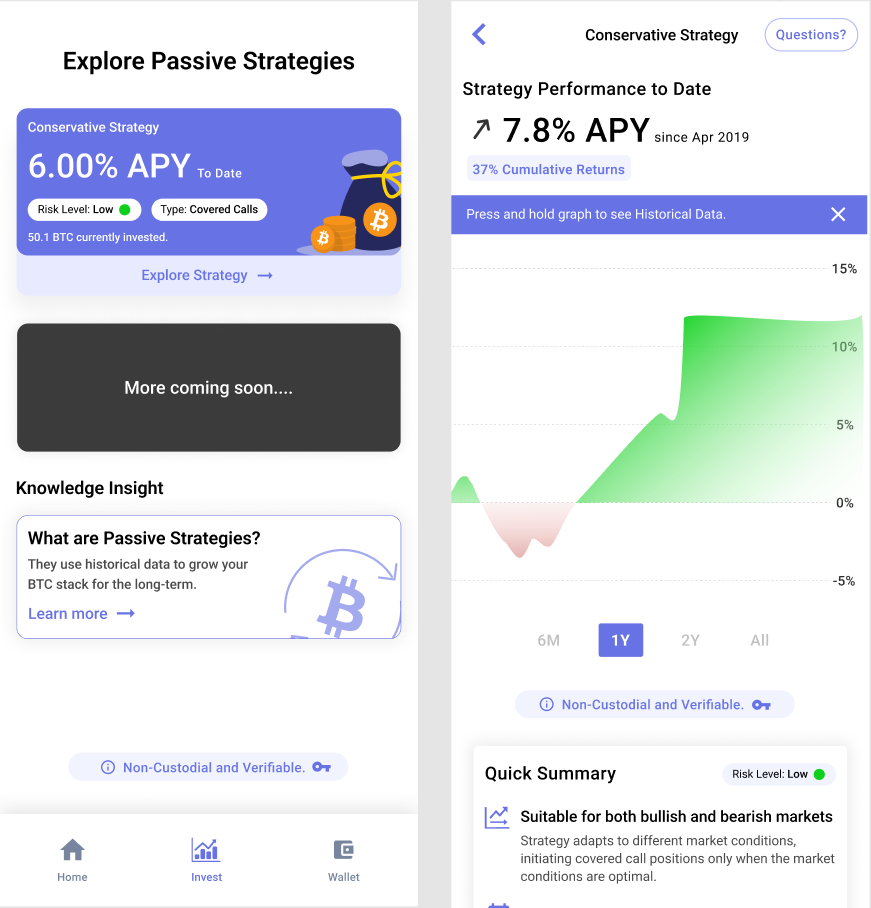
We do this through a process known as incubation. Incubation involves following along with a strategy in real time prior to launching it to ensure live performance roughly matches our expectations from backtesting. For the Conservative Covered Call Strategy, our incubation process lasted for 3 months prior to launching it with our users.
All this work with TA Fitting, Options Backtesting, and Incubation culminated in the development of the Conservative Covered Call Strategy!
Conservative Covered Call Strategy vs Bitcoin Pumps
So, how does the Conservative Covered Call Strategy square up against some of the pumps we've seen in Bitcoin since 2019 (the beginning of the options backtest). Let's explore a few examples.
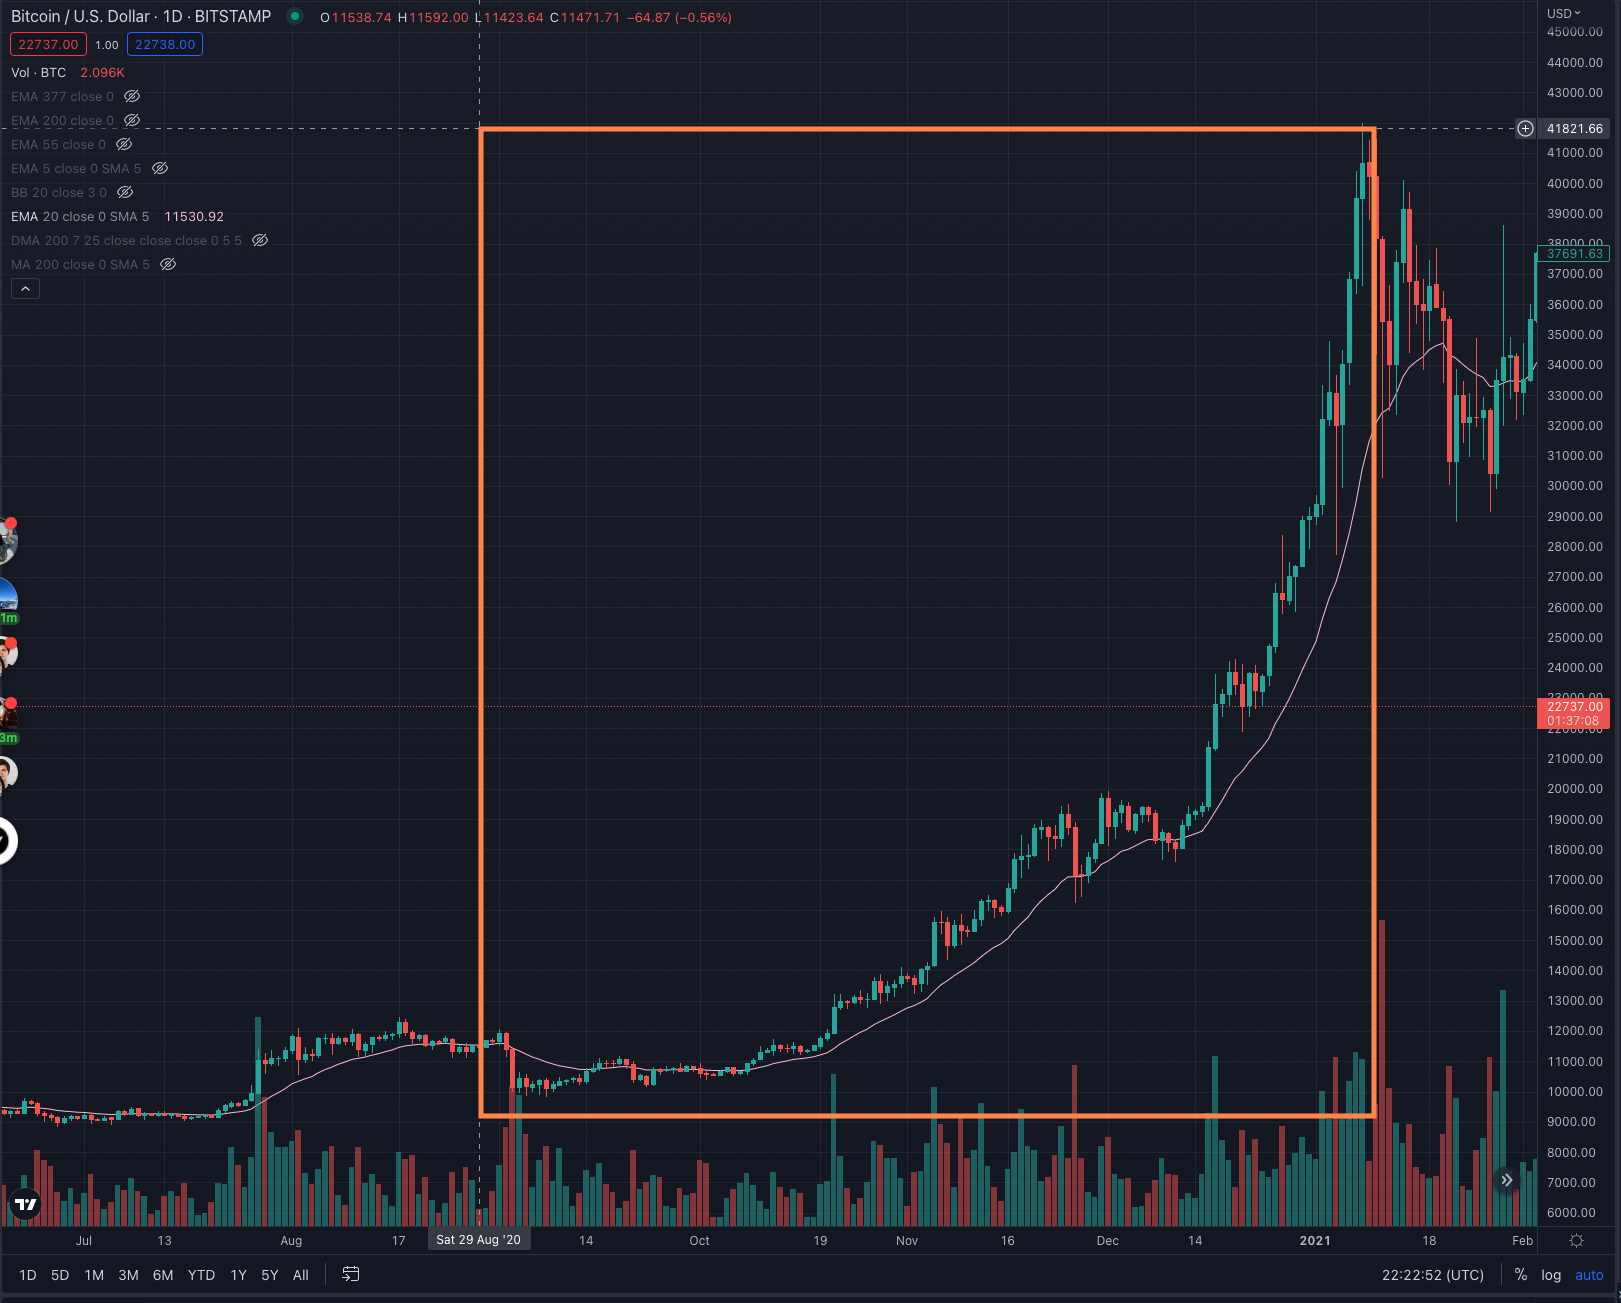
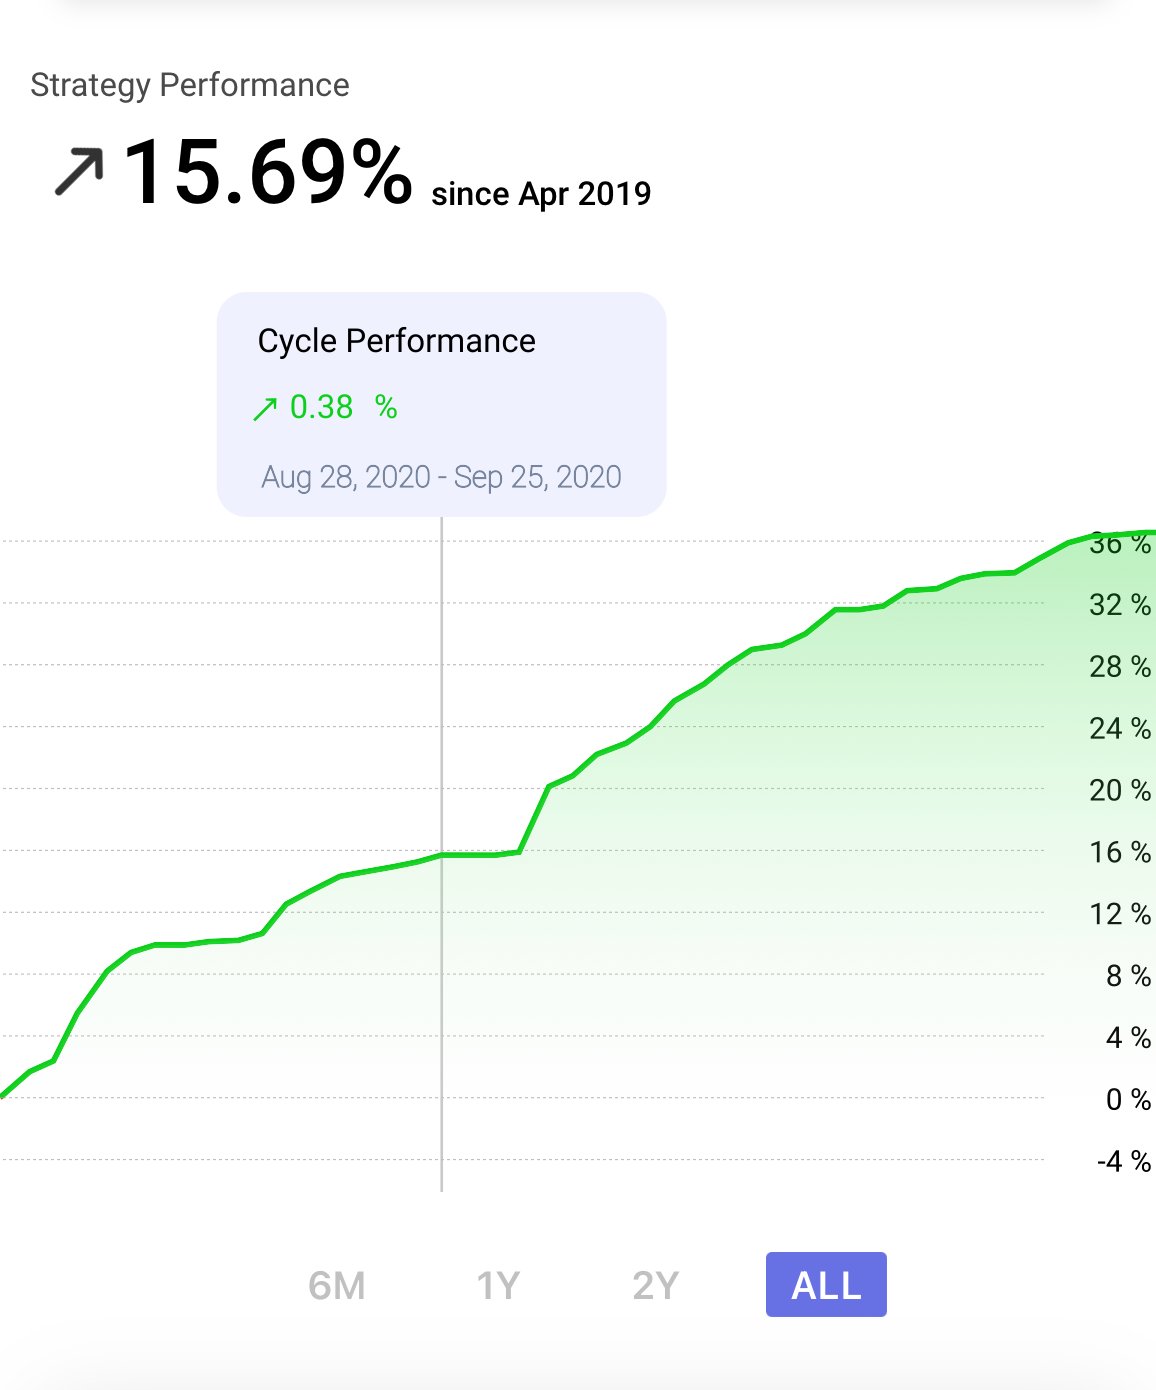
- [Historical example, Walk Forward Testing] Great bull run of Sep - Dec 2020
Covered Call Strategy: +0.55% during those months
Despite BTC rising from around 10K all the way to 40K+ over the span of these three months, the V2 strategy performed admirably in the walk-forward test — choosing often to be conservative and remaining on the sidelines, and avoiding serious losses.
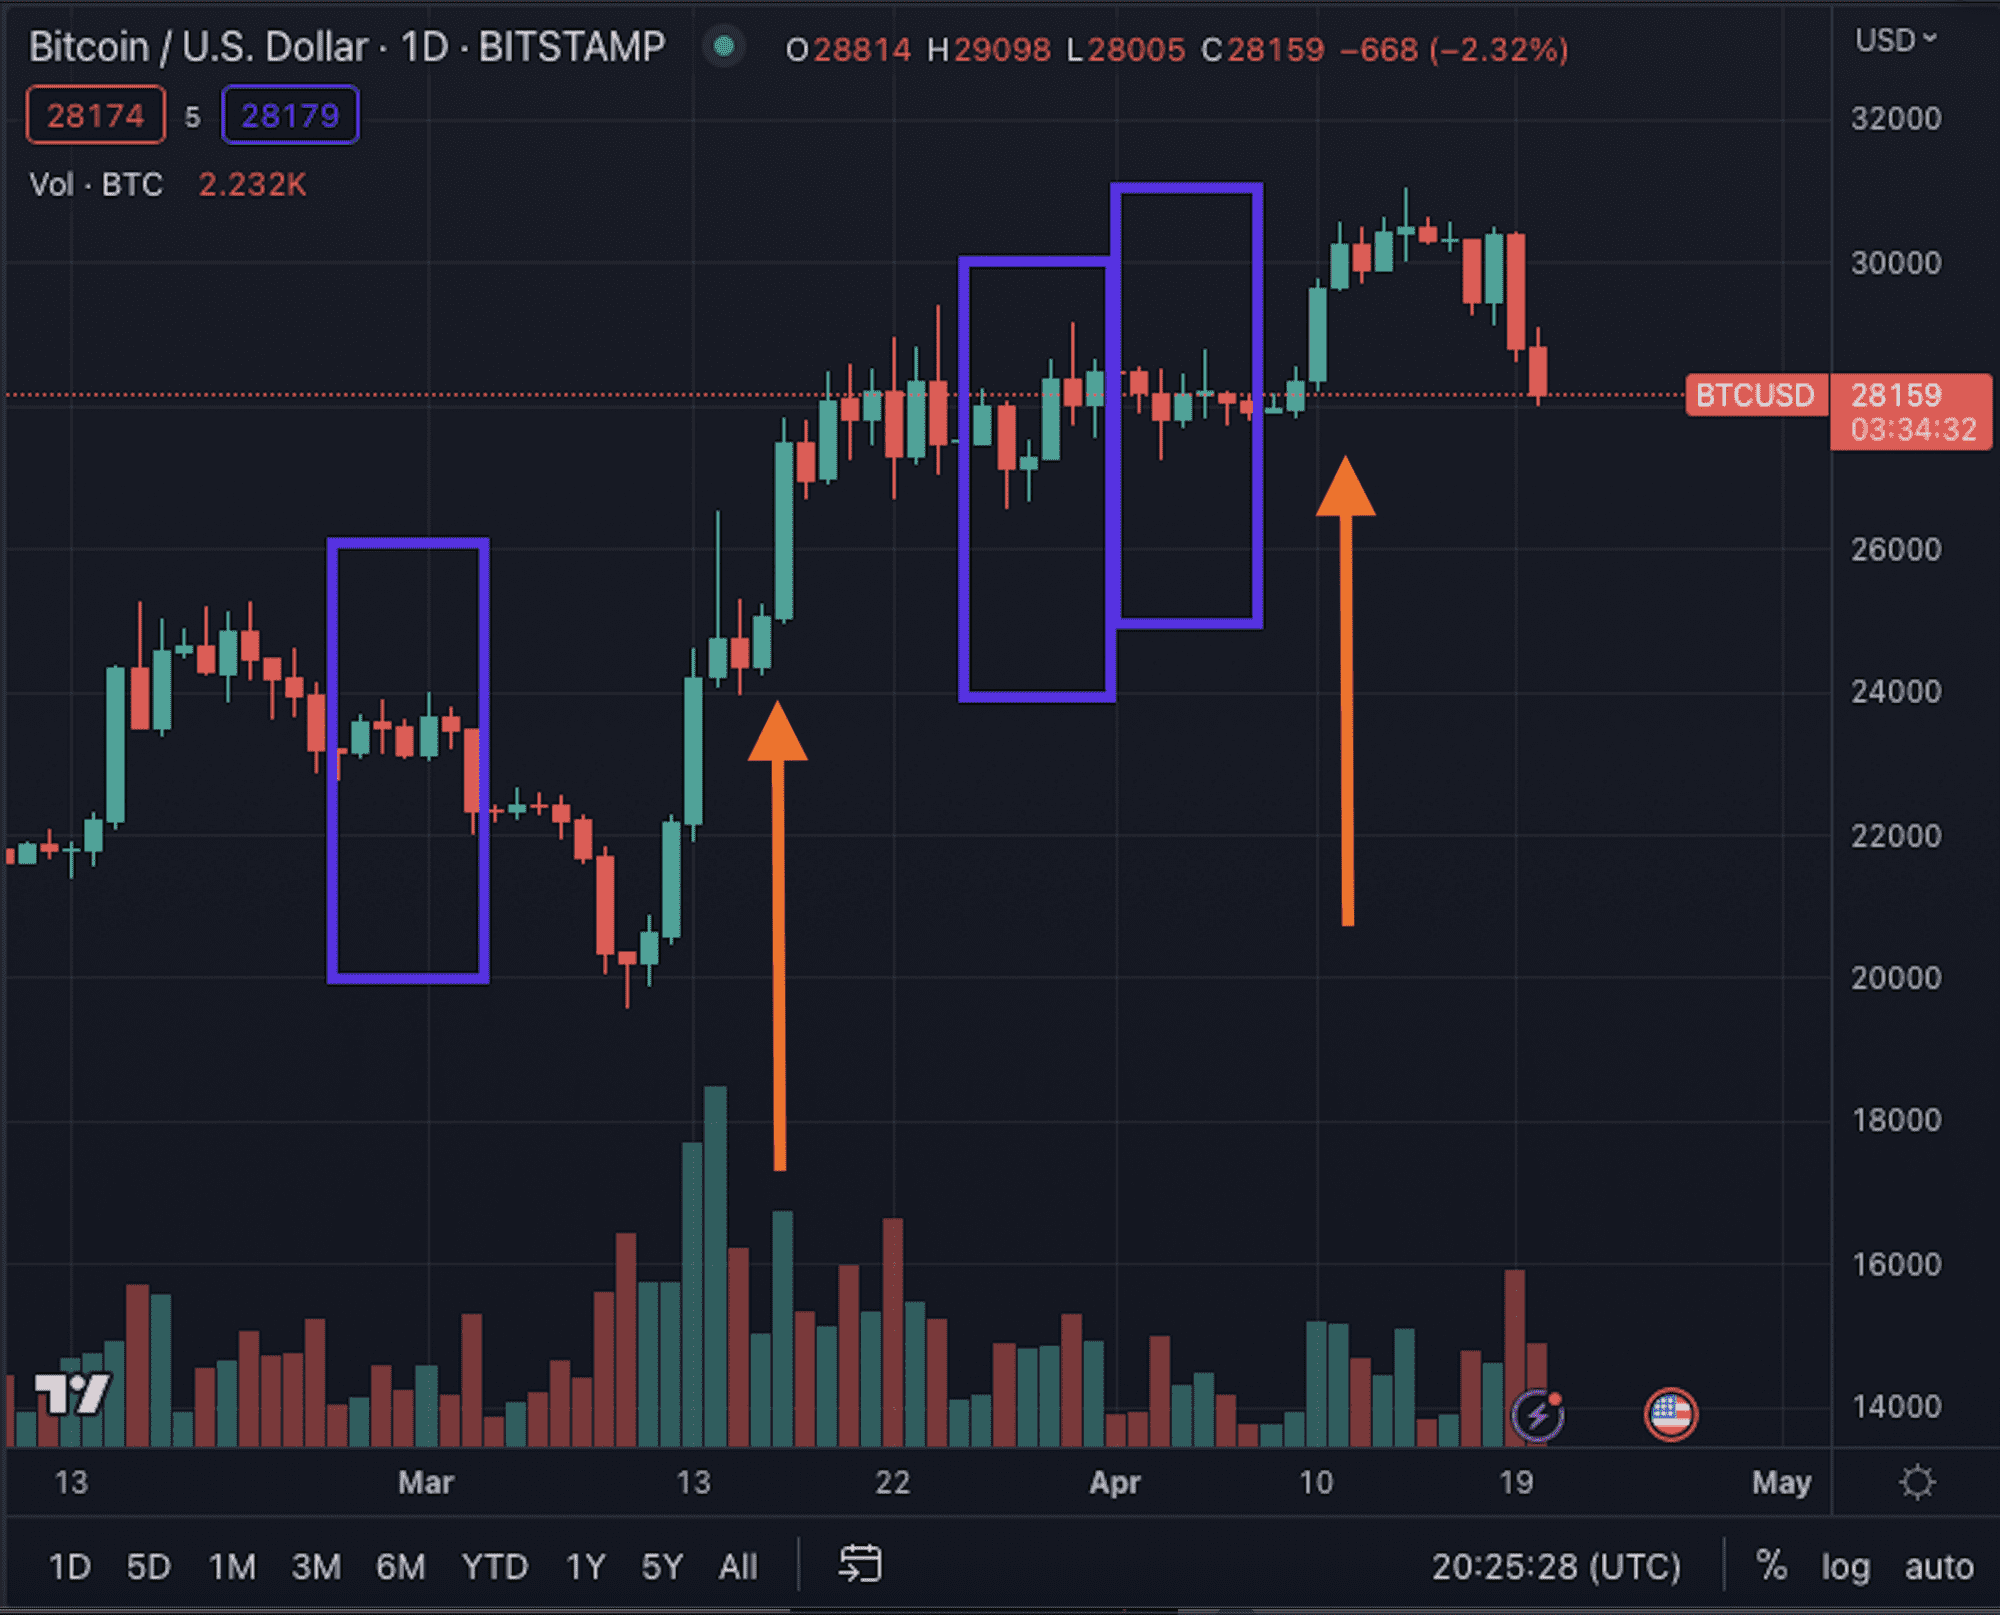
2. [Recent example, Live trading] BTC's pump from 20K to 27K over a few days in March '23.
Covered Call Strategy: +0.14% that month
In March 2023 (after the strategy began live trading), we saw Bitcoin rise from 20K to 27K (35%) over the course of a week. Despite this rapid pump, the covered call strategy performed admirably.
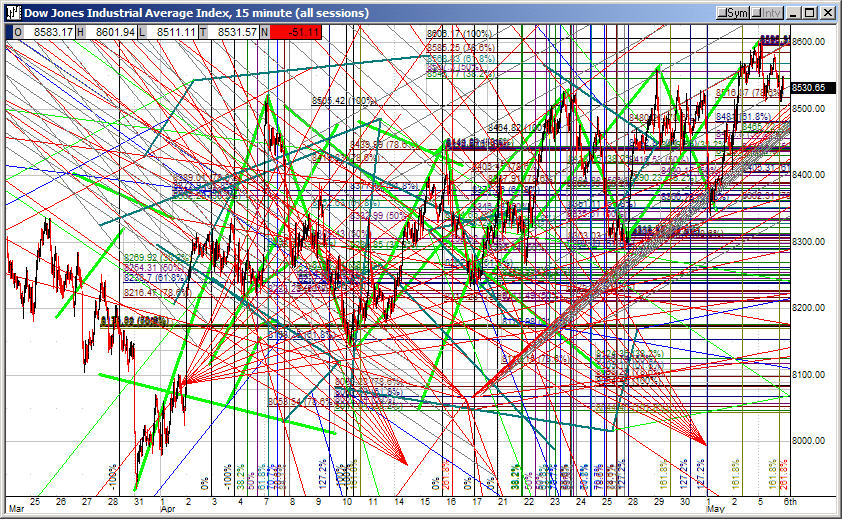
In the BTC price chart below, you can see TA Fitting logic at work over the Feb-Apr '23 period - with the purple boxes indicating the times in which the strategy entered a covered call. The orange arrows denote mini-pumps in BTC price where the Covered Call Strategy sat on the sidelines, thereby avoiding what could have been losses.
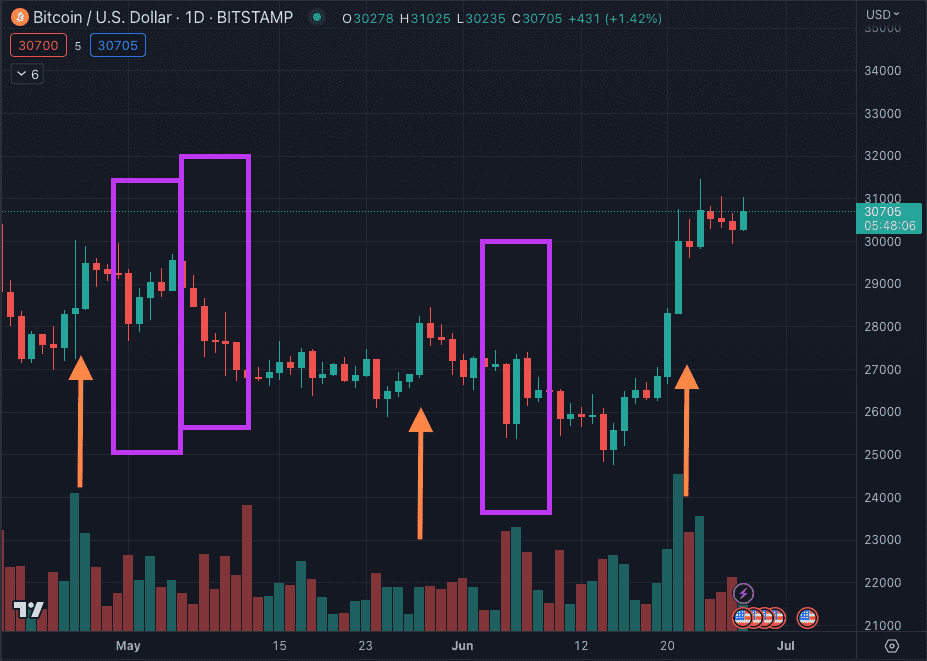
3. [Recent example, Live trading] BTC's pump from 25K to 31K (25%) over a few days in June '23.
Covered Call Strategy: +0.1% that month
Even more recently in June 2023, we saw Bitcoin rise from 24.8K to 31K (+25%) over the course of a week. Despite this rapid pump, the covered call strategy performed admirably.
In the BTC price chart below, you can see TA Fitting logic at work over the May-June '23 period - with the purple boxes indicating the times in which the strategy entered a covered call. The orange arrows denote mini-pumps in BTC price where the Covered Call Strategy sat on the sidelines, thereby avoiding what could have been losses.
Conclusion
Backtesting can be a meticulous process, blending data-driven insights with strategic decision-making. While no backtested strategy is foolproof, our hope is that this blog gives our users a glimpse into the inner workings of what backtesting and strategy development actually entails, the intricacies involved, and also the steps taken to ensure to long-term robustness of strategies.
As time goes on, we will continue to improve our processes, develop new strategies and launch new features within Atomic.Finance in the upcoming months.
We're just getting started with #SoundFinance and we can't wait to show you what's next 💪
A huge thanks to Randy Chen and Kenny Yeung for helping us with develop our backtesting tools and processes. 🙏